
NetAI converts topology + telemetry into a deterministic RCA chain. Same input, same RCA. Auditable. Topology-grounded. Operational. Root Cause, Blast Radius, Verified Action.
Observe
Topology + telemetry
Explain
Deterministic RCA chain
Act
Guided execution with guardrails
“NetAI is part of Google Cloud's Autonomous Network Operations initiative, delivering graph-native, deterministic intelligence for telecom operators at scale.”
Google Cloud Blog, MWC 2026
Proven Results
Done
The Graph Isolates Root Cause and Clears Every Correlated Ticket
All
Correlated Alerts Cleared per Root Cause
One
Actionable Ticket per Incident, Not Hundreds
Zero
Hallucinations. The Graph Doesn't Guess
Platform Capabilities
The only AIOps platform built from the ground up on Graph Neural Networks. Not a repurposed IT monitoring tool with LLM-based AI bolted on.
While an LLM waits to be told something happened, the graph has already isolated root cause and cleared every correlated ticket.
LLMs are reactive. They need to be prompted. The GNN is always watching your live topology, and the moment a failure occurs, it goes to work connecting every dot across every layer of your network.
When an incident hits, you need two things: what caused it, and everything it affected. NetAI is the only platform that delivers both with GNN-powered precision. Deterministic root cause identification and full event correlation across every layer of your network. No other vendor has solved this at this level.
Automated discovery and live visualization across OSPF, IP, MPLS, and Layer 2. See your entire network as a living graph, from access to core to transport. Eliminate blind spots with continuous, protocol-aware mapping of every device and connection.
When a fault occurs, NetAI instantly maps the blast radius: every affected device, link, and service. Collapse thousands of alarms into a single actionable incident with full context on what is impacted and why.
From fault detection to diagnosis to fix recommendation. Automated remediation workflows with rollback, integrated with ServiceNow, Jira, and BMC Remedy. Moving toward fully self-fixing networks.
One platform for every brand, every model, every protocol. SNMP, syslog, NetFlow, NETCONF, SSH, REST APIs, gNMI, and more. No vendor lock-in, no gaps. Built for multi-vendor service provider and enterprise networks.
NetAI is part of Google's Autonomous Network Operations (ANO) initiative. Our GNN-powered engine is being developed alongside Google Cloud to bring deterministic network intelligence to global service providers at scale.
Product Family
The first and only AIOps platform using Graph Neural Networks for deterministic root cause analysis. Every other vendor uses LLMs. GraphIQ uses GNNs for causal reasoning, advanced event correlation, and automated remediation.
Modern, vendor-agnostic Network Management System for mission-critical operations. Unified monitoring, alert management, automated topology discovery, and ITSM integrations. Your on-ramp to GNN-powered AI with GraphIQ.

Instant answers at the network edge. Reduce support calls with real-time diagnostics and self-service troubleshooting for field teams and end users.
See It in Action
Every step of the demo flow, from topology discovery to closed-loop remediation. This is what deterministic network intelligence looks like in practice.
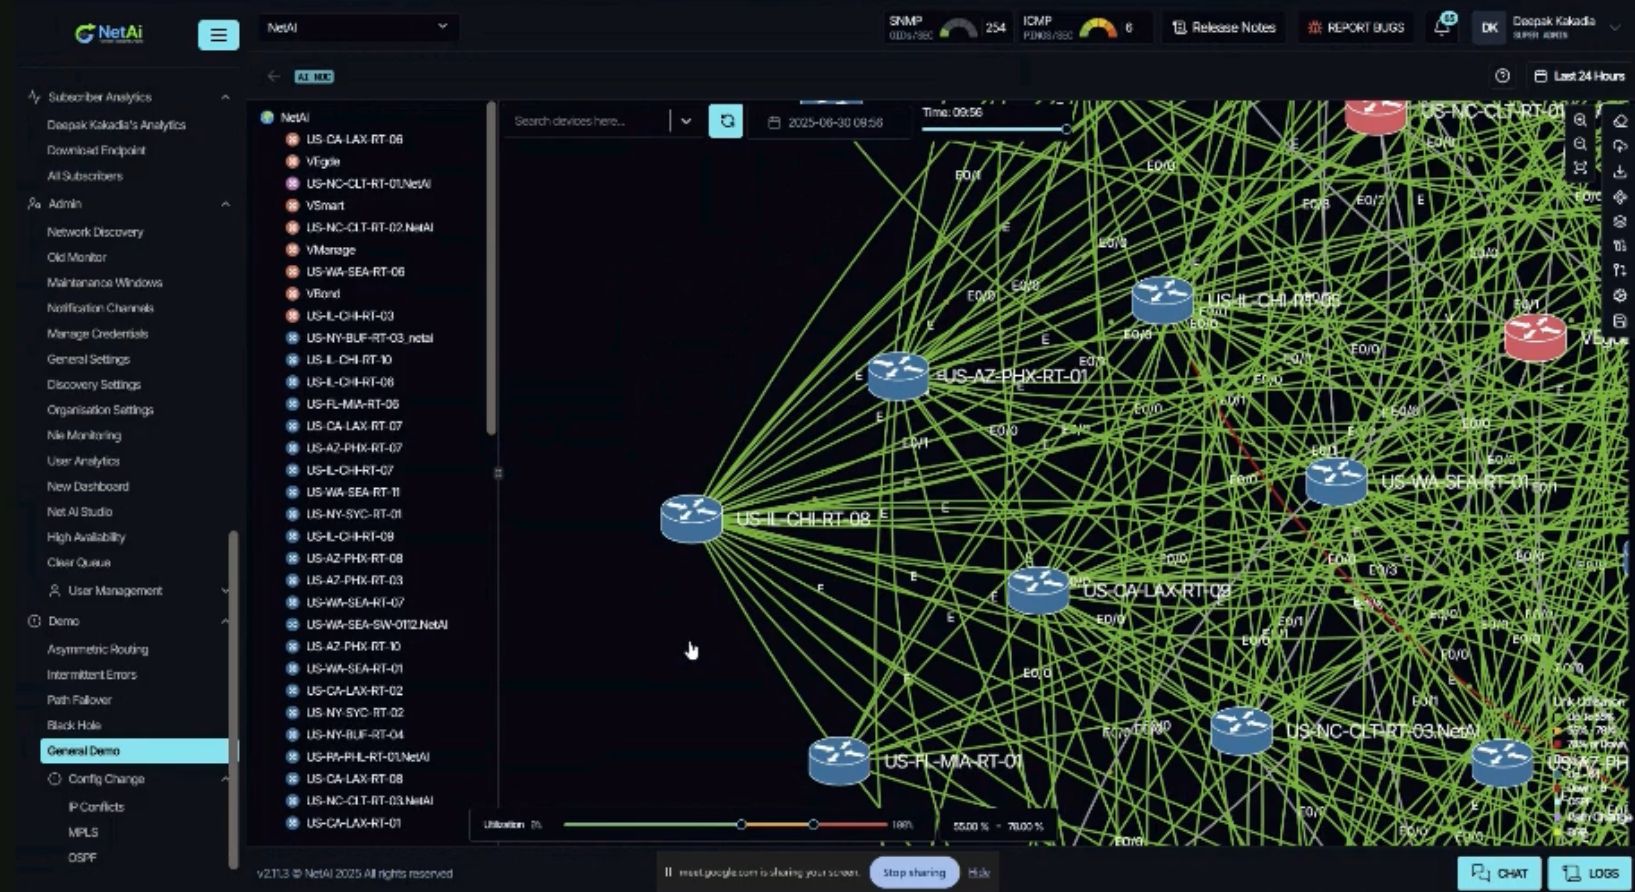
NetAI consumes telemetry and configuration data from your environment and renders a live network graph with geo-coordinates. The topology is always current - every device, link, and protocol relationship mapped automatically.
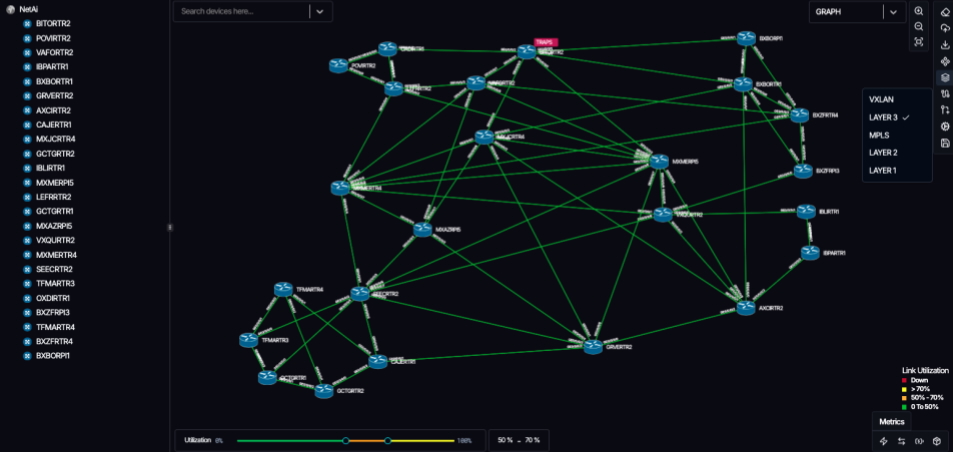
A 2D graph view of the full network with multi-layer toggle across VXLAN, Layer 3, MPLS, Layer 2, and Layer 1. Link utilization heatmap highlights congestion and degraded paths in real time. Every layer, one view.
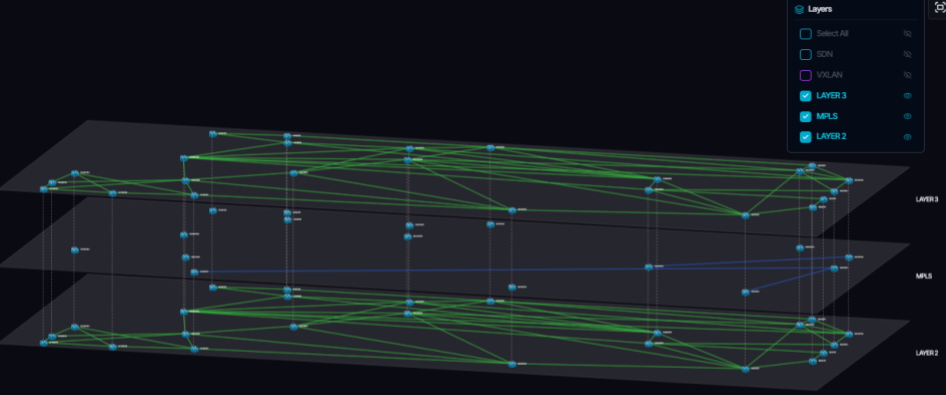
The same network rendered in 3D across Layer 3, MPLS, and Layer 2 simultaneously. Cross-layer relationships and tunnel paths are immediately visible. When a fault occurs, the blast radius is identified across all layers at once.
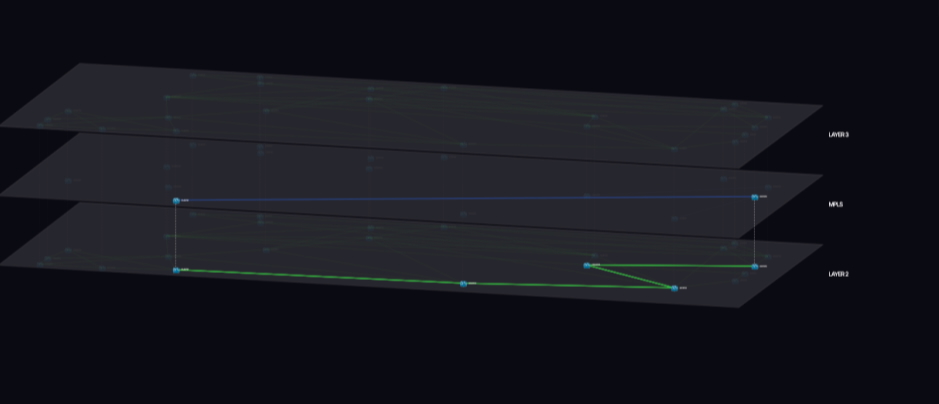
When a fault is detected, the GNN isolates the affected tunnel path in 3D. This view shows the MPLS tunnel relationship between the root cause device and its downstream neighbor - exactly where the failure propagated and why.
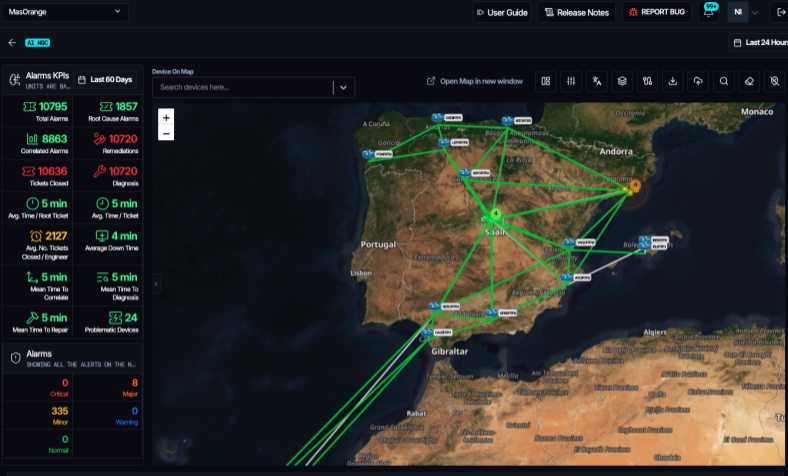
The Alarms KPI panel shows the full operational picture: 10,795 total alarms, 1,857 root cause alarms, 8,863 correlated alarms, and 10,720 remediations over 60 days. Every metric tied to a specific root cause, not a noise count.
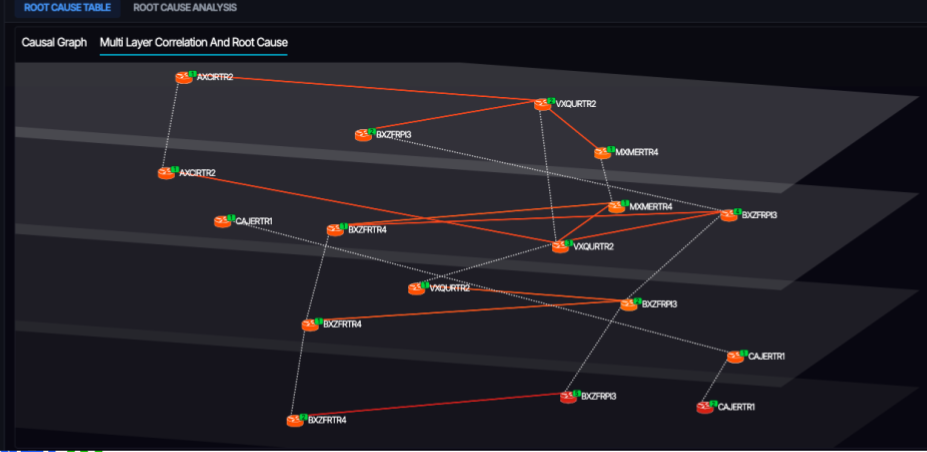
The GNN's causal graph visualizes the incident across protocol layers simultaneously. Orange nodes are affected devices. Red lines are causal correlations. The graph identifies root cause and every downstream impact in a single deterministic view - no LLM can produce this.
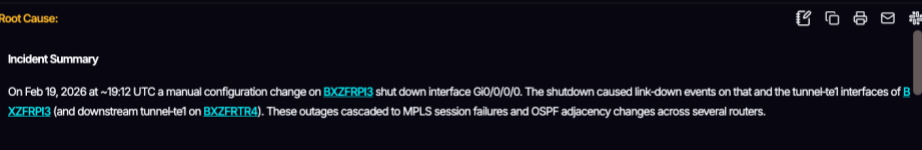
The GNN generates a plain-English incident summary in seconds. On Feb 19, 2026, a manual configuration change on BXZFRP13 shut down interface Gi0/0/0/0, cascading to MPLS session failures and OSPF adjacency changes across multiple routers. Deterministic. Traceable. No guesswork.
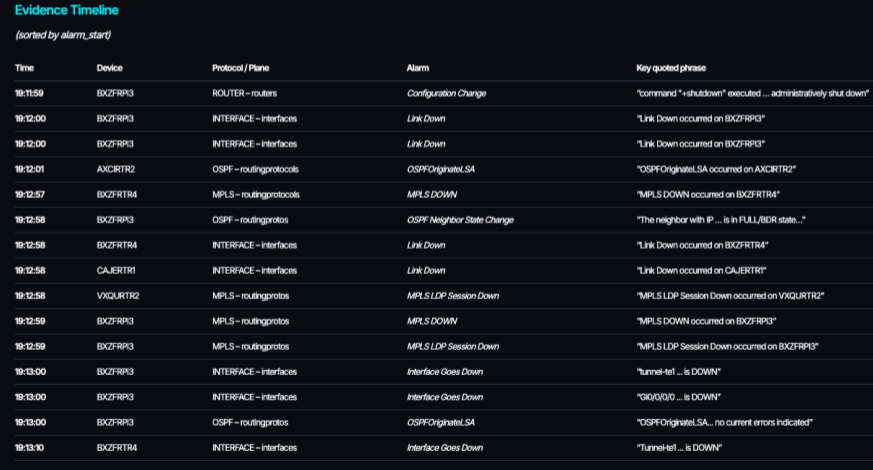
A chronological log of every alarm in the incident, sorted by alarm_start. Each entry shows the device, protocol plane, alarm type, and the exact quoted phrase from the device log. Every answer is fully auditable and exportable for post-incident review.
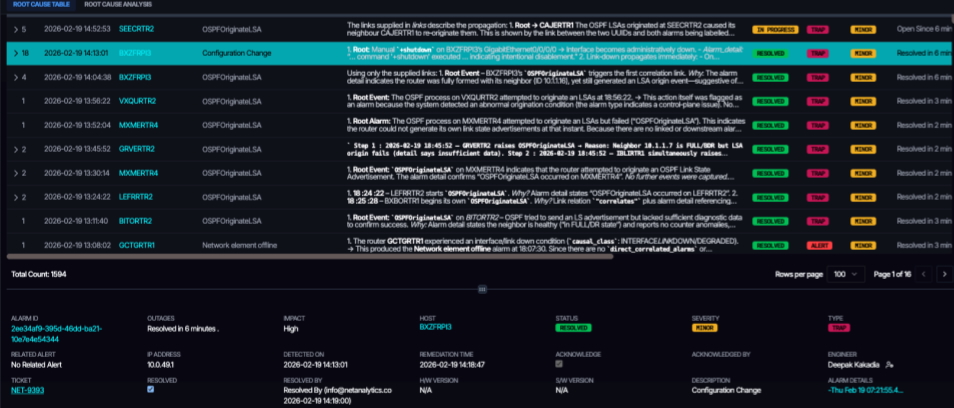
The Root Cause Table shows every correlated alarm with its causal chain narrative, resolution timeline, engineer assignment, and ticket status. 1,694 total alarms resolved to a single root cause. One engineer. One ticket. Every alarm accounted for.
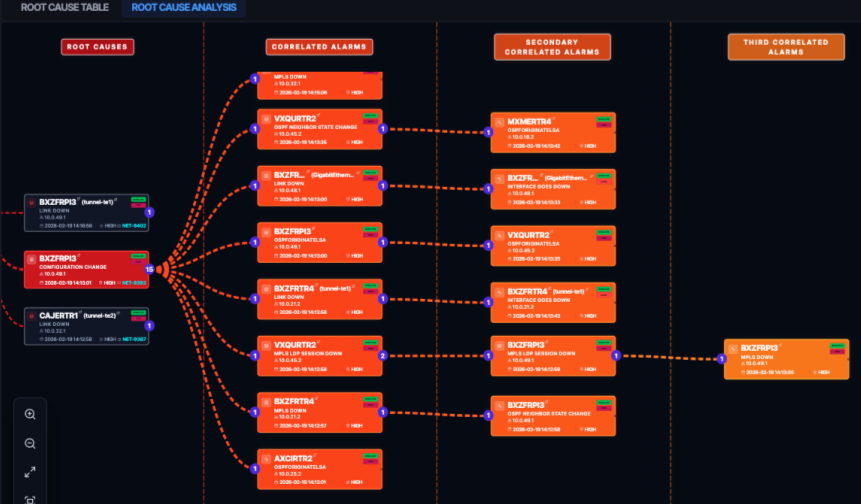
The causal impact tree maps 1st, 2nd, and 3rd level correlations from the root cause across protocol layers. This structural, topology-grounded view is what separates GNN causal reasoning from LLM and ML correlation - causation, not coincidence.
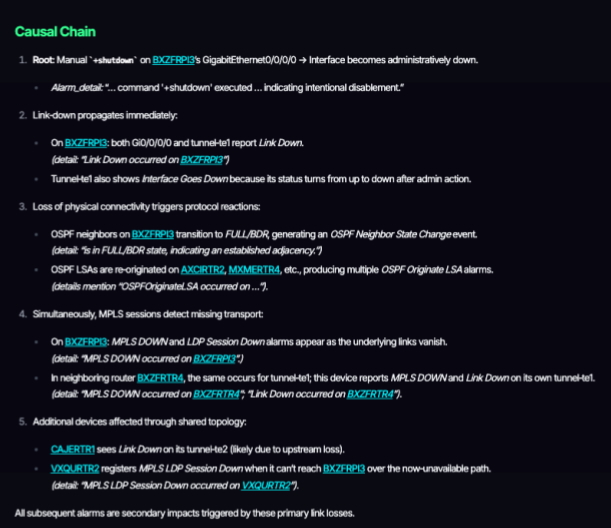
A numbered, step-by-step causal chain: from the root manual shutdown on BXZFRP13, through link-down propagation, OSPF neighbor state changes, MPLS session failures, and every downstream device impact. Every hop explained with device-level alarm evidence.
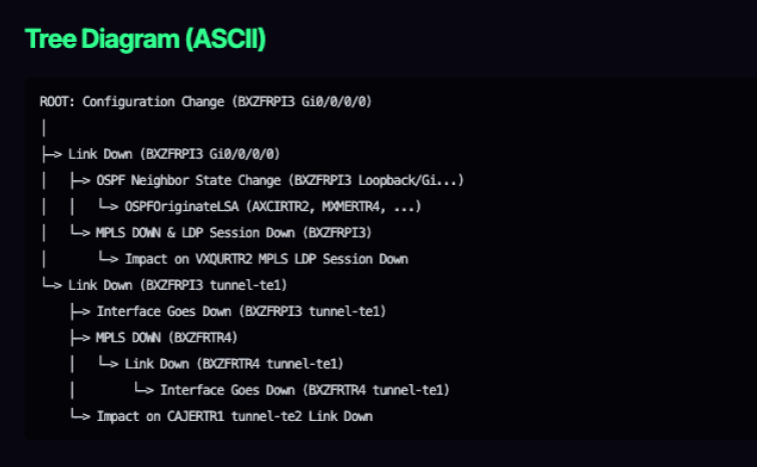
A machine-readable ASCII tree of the full causal propagation path - from ROOT configuration change through every downstream link-down, OSPF, MPLS, and interface impact. Structured for export, ITSM ticket attachment, and post-incident review.
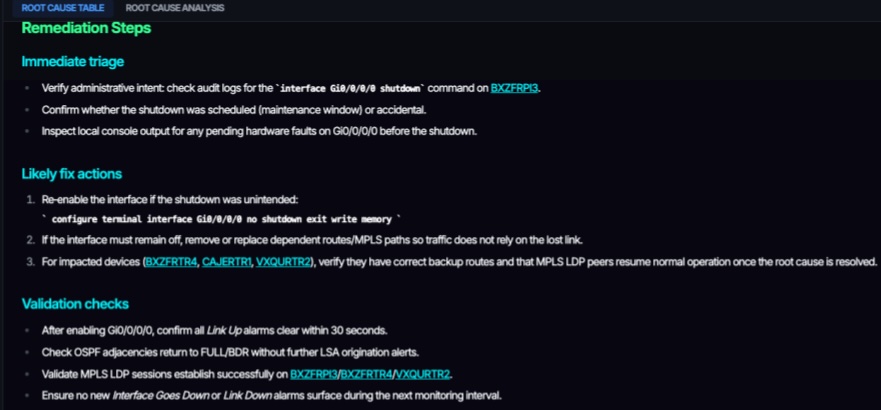
The GNN delivers specific, actionable remediation: immediate triage steps, exact CLI commands to restore the interface, and validation checks to confirm OSPF adjacencies and MPLS LDP sessions are re-established. From root cause to network restored.

See how NetAI™ reduces MTTR, eliminates alert fatigue, and gives your team the visibility they need. Schedule a live demo with our team.
Request a Demo